
India awarded substantially more national-highway work in the first half of this financial year, while its ports handled more cargo. Those are encouraging signals for infrastructure activity, but they describe different stages of the process.
The Ministry of Statistics and Programme Implementation’s October 16, 2026 update helps separate them. Contracts point to work ahead. Freight volumes record activity already handled. Businesses need both, alongside evidence about the quality and cost of the service.
The Breakdown
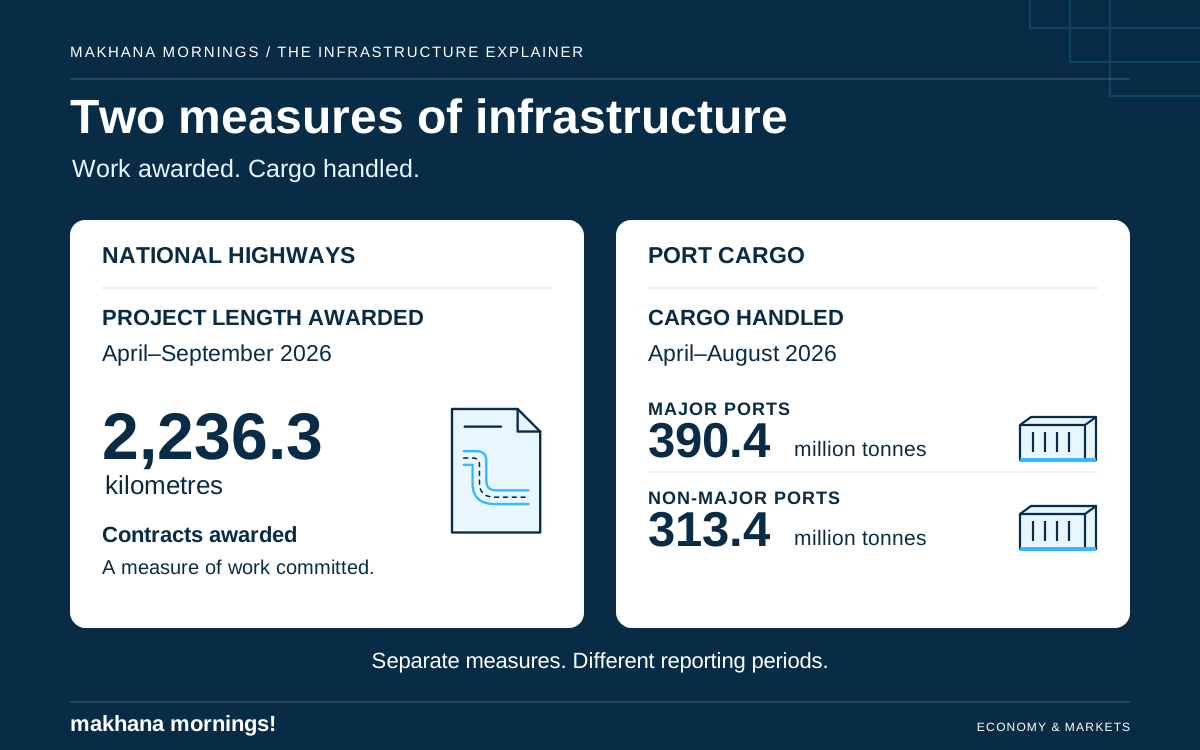
National-highway projects covering 2,236.3 km were awarded during April–September 2026, up 62.9% from the same six months a year earlier. This is the first half of FY2026–27.
The port figures cover a shorter period, April–August 2026. Major ports handled 390.4 million tonnes, up 7.2% year on year. Non-major ports handled 313.4 million tonnes, up 1.8%. Each growth rate compares its own port group with the corresponding five months of the previous year.
A contract is an early milestone
The highway number measures the length of projects awarded. It does not mean that 2,236.3 km of roads opened to traffic during those six months, or that construction itself rose by 62.9%.
For a supplier or contractor, awards can help identify future work. For a business moving goods, the relevant question is when a route becomes usable and what service it provides. An award alone does not establish the completion date, the time saved or the commercial return.
The distinction also prevents a misleading comparison with ports. One figure concerns contracts; the other concerns cargo already handled. Their percentage growth rates cannot be ranked as if they measured the same output.
Activity needs its own context
The port data shows that cargo growth differed between the two groups over the same period. It does not establish that the faster-growing group became more efficient. More tonnes handled and shorter waits are separate measures.
Road-use data carries another distinction. Electronic toll transactions rose 24.1% year on year to 225.2 crore during April–September 2026. The amount collected over the same period increased more slowly, by 11.7%, to ₹36,994.5 crore.
A transaction count is not a count of unique vehicles or a measure of the weight of goods carried. The gap between transaction growth and collection growth also does not, on its own, prove that toll rates fell. Explaining it would require details about the journeys, vehicle mix and charges behind the totals.
The Big Picture
MoSPI’s PAIMANA dashboard draws on data supplied by ministries, departments and official publications. It tracks access, quality, fiscal cost and revenue, utilisation, and affordability. These dimensions matter because building an asset, using it and receiving good service from it are separate tests.
A quarterly publication is not necessarily a single-quarter economic snapshot. This release combines the current financial year’s partial-period figures with older annual indicators in other sectors. The reporting period needs to travel with each number.
For businesses, the next questions are practical: which awarded projects reach completion, whether busy routes and terminals remain reliable, and what users pay for the service. The new figures provide evidence about activity; they do not answer all of those questions.
The Crunch
The increase in highway kilometres awarded points to more work committed. Cargo volumes show activity already handled. Neither measure, by itself, establishes that journeys are faster or logistics costs are lower. India’s infrastructure progress is best judged by following projects through to the service they deliver.