
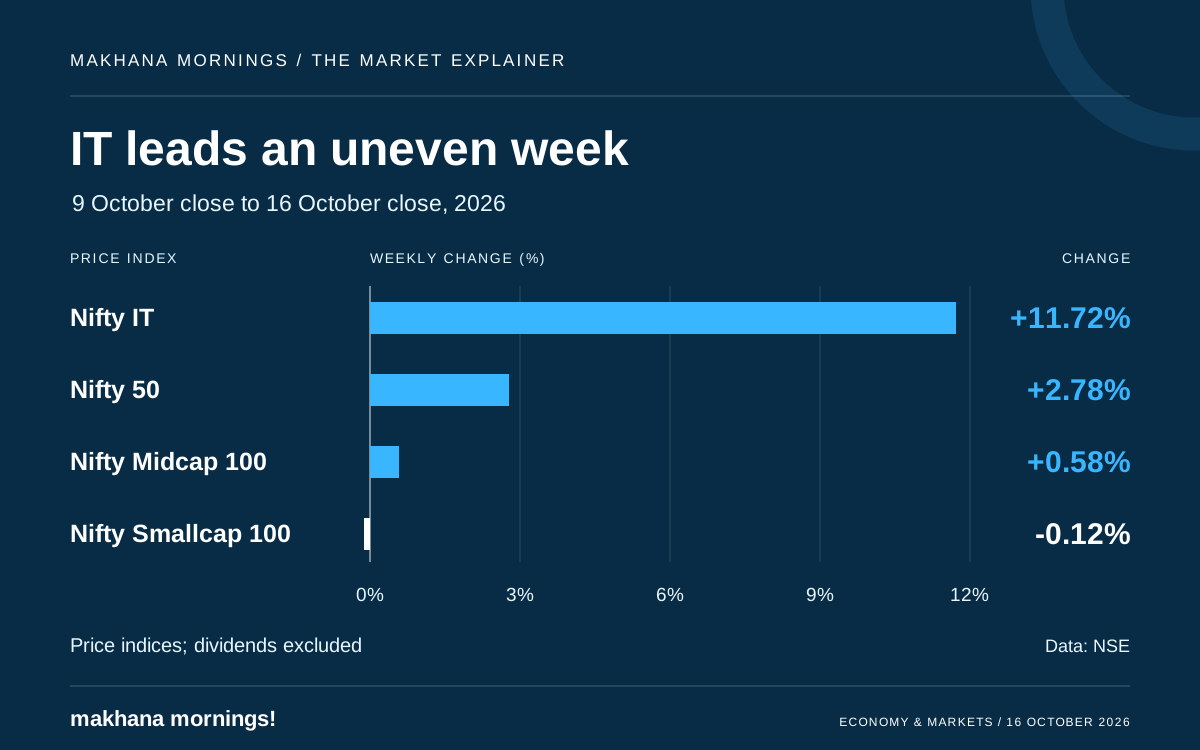
Indian equities finished the week higher, with IT shares making a much stronger recovery than the broader market. The gap matters: a rally in a prominent sector can create a different impression from the experience of other listed businesses.
NSE’s closing data shows the Nifty IT index gained 11.72% in the week ended October 16, 2026. The Nifty 50 rose 2.78% over the same period. The gains were much smaller in the mid-cap benchmark, while the small-cap benchmark edged lower.
The Breakdown
On Friday, the Nifty 50 closed at 23,146.15, up 148.80 points, or 0.65%, for the session. Nifty IT finished at 31,924.10, rising 3.92% that day.
Across the week, Nifty Midcap 100 gained 0.58%, while Nifty Smallcap 100 fell 0.12%. Nifty 500, a wider benchmark than Nifty 50, rose 1.84%.
These weekly changes compare the October 16 closing levels with October 9. They measure changes in the price indices, without adding dividend income. Friday’s daily gain is part of the weekly result, rather than an extra return to add on top.
Why the benchmark matters
Nifty 50 covers 50 stocks across important sectors of the economy. Its weights reflect the market value of shares available for public trading, so companies have different degrees of influence. A rise in the index does not mean every constituent rose by the same amount.
Nifty IT measures a narrower sector. The mid- and small-cap indices track different groups of companies. Comparing their percentage changes gives a fuller view of where gains were strongest, although it still does not show how every individual share performed.
This week’s figures show a pronounced gap between IT and the wider benchmarks. They do not establish why each investor traded, or how much of the Nifty 50’s gain came from any single factor.
What the business results show
The earnings released during the week offer useful context. For the quarter ended September 30, Tech Mahindra reported 2.4% revenue growth from the previous quarter in constant-currency terms. Wipro’s IT-services revenue was flat on that sequential basis.
Constant-currency reporting reduces the effect of exchange-rate movements. It does not remove differences in business mix or automatically exclude acquisitions. These two company results illustrate variation within the sector; they are not a survey of demand across the whole industry.
They also cover a different period from the market move. Quarterly revenue records business delivered over three months. A weekly share-price change records how the market valued companies during that week. The two can move at different speeds.
The Big Picture
For people who follow the IT industry for work, the useful question is how changing market expectations compare with actual business activity. Sales growth, the progress of signed projects and the conversion of earnings into cash provide evidence that a sector index cannot supply.
The same distinction applies to the wider economy. Large-company shares, smaller-company shares and operating results offer different views. Reading them together gives a more useful picture than treating one strong market number as a verdict on every business.
The Crunch
The week’s rebound was real, but its strength varied sharply across the market. IT shares rose much faster than the broader benchmarks, while company results still showed different growth paths. Prices, the spread of gains and delivered business performance each deserve their own reading.