
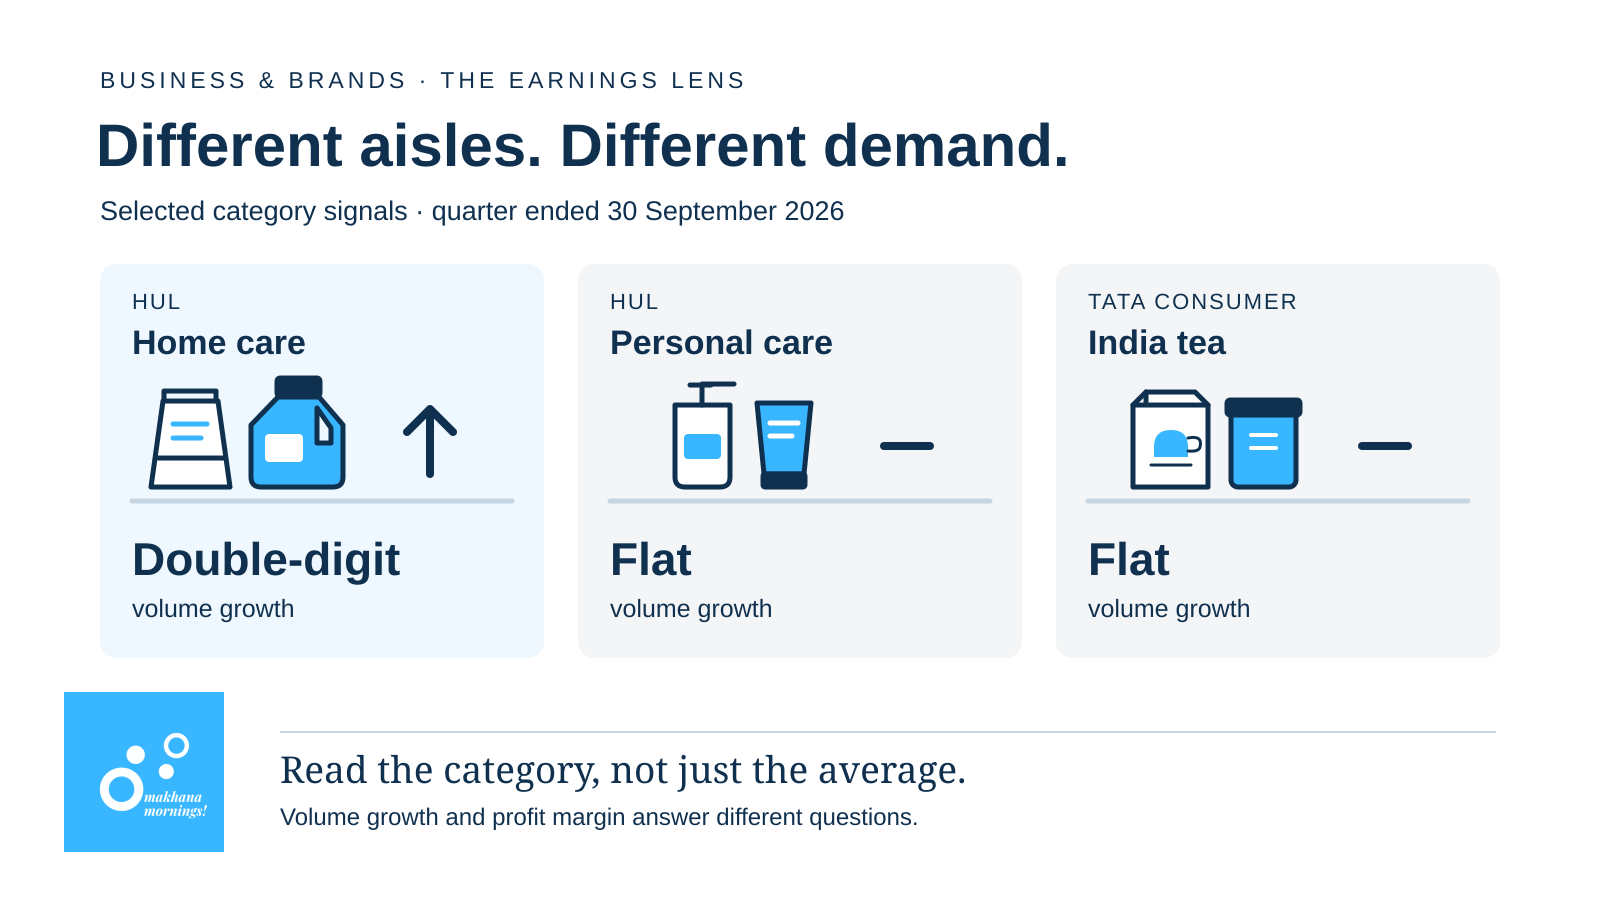
The demand story changes as you move along the supermarket shelf. HUL’s latest results show faster volume growth in home care than in personal care. Tata Consumer’s stronger India business includes a tea business whose reported volumes were flat.
Taken together, the two updates for the September quarter suggest a more useful question for brands than whether consumption is simply strong or weak: which categories are growing, and how much of that growth reaches profit?
The Breakdown
HUL reported 15% underlying sales growth and 7% underlying volume growth for the quarter ended September 30, 2026. Its definition of volume growth includes changes in product mix, so the figure should not be read as a simple count of additional packs sold.
Its presentation reports double-digit volume growth in home care and beauty and wellbeing, flat volume growth in personal care, and low-single-digit growth in foods. Those differences matter more to a category manager than the figure for the company as a whole.
Tata Consumer’s October 26 update covers the same quarter. It reported 11% underlying volume growth in its India branded business, led by salt. India tea volumes were flat, while Tata Sampann revenue grew 57%. Revenue growth and volume growth are different measures: the Sampann figure does not establish how much more product customers bought.
Why This Matters
A company can expand through a stronger category, better distribution or a different product mix even while another part of its portfolio struggles. For a smaller brand, an attractive national headline is therefore only a starting point. The relevant tests concern its own category, price point, distribution and repeat demand.
These results are not a comparison on a like-for-like basis. HUL’s underlying volume figure, reported with its consolidated results, and Tata Consumer’s India branded figure cover different businesses. Neither tells us how spending changed for the average Indian household.
The Big Picture
Profitability adds another distinction. HUL’s consolidated EBITDA rose 8%, but its EBITDA margin fell 1.4 percentage points to 22.6%. EBITDA measures earnings before interest, tax, depreciation and amortisation; the margin expresses that amount relative to revenue.
Tata Consumer reported consolidated revenue growth of 14% and EBITDA growth of 18%. That is a different direction of travel, not evidence that one company has solved the other’s challenges. Their portfolios and geographic exposure differ.
The Crunch
Read the category before relying on the company average. Then check the definition of growth and the profit margin. These updates offer useful business signals, but they do not support one sweeping verdict on Indian consumption.



Leave your thoughts