
A truck can be cheaper to run for every kilometre and still cost more to deliver a tonne. That happens if it carries less each time or completes fewer runs. The comparison that matters is what it costs to deliver the same cargo on the same route, within the same delivery window.
Start with what reaches the customer
For a repeat lane, divide the total cost of the trucks serving it by the tonnes accepted at delivery over the same period. Include the empty leg in kilometres and cost, but not in tonnes delivered. If the return leg carries somebody else’s goods, account for both legs consistently: use the total cost and total delivered tonnes for both, or allocate shared costs and compare outbound economics separately. Use tonne-kilometres when comparing lanes of different lengths, and specify the loaded distance used for that denominator.
Build the numerator from vehicle ownership or lease costs, driver and dispatch costs, energy, maintenance, tyres, tolls and other route fees. Count charger maintenance, site rent and grid or demand charges if you bear them; avoid adding costs already in the charging price. Use metered electricity at the point of billing, or explicitly allow for charging losses when starting from dashboard consumption. Model battery replacement separately only if it is outside your lease or warranty and relevant to the period. Use either lease payments or an equivalent ownership cost, not both. Include the cost of backup trucks or outsourced tonnes if the remaining fleet cannot meet the committed volume.

CEEW’s Delhi–Agra freight-corridor study calls out the trade-off between payload, battery size, range and cost per km. It also highlights the effect of waiting, empty runs and low utilisation. The exercise below takes that one step further: it compares what gets delivered.
A worked example on one route
Imagine a depot hauling packaged industrial goods 80 km to a customer, then returning empty. A cycle is 160 km. Both trucks face the same delivery windows and are assumed able to complete two cycles per operating day in the base case. All the numbers below are illustrative inputs, not quotes, tariffs, certified payloads, fleet results or market averages. Assume the freight is weight-limited so that the proposed payload matters. No subsidy, toll, taxes or extra back-up costs are modelled; add any that differ or materially affect a real route.

| Assumption or result per operating day | Electric | Diesel |
|---|---|---|
| Payload actually accepted per loaded run | 18 tonnes | 20 tonnes |
| Round trips / total driving distance | 2 / 320 km | 2 / 320 km |
| Fixed daily cost incl. vehicle, driver and allocated site cost | ₹6,400 | ₹4,400 |
| Energy use and unit price | 1.2 billed kWh/km × ₹9 | 3.2 km/litre at ₹90/litre |
| Other variable cost | ₹5/km | ₹6/km |
| Total daily cost | ₹11,456 | ₹15,320 |
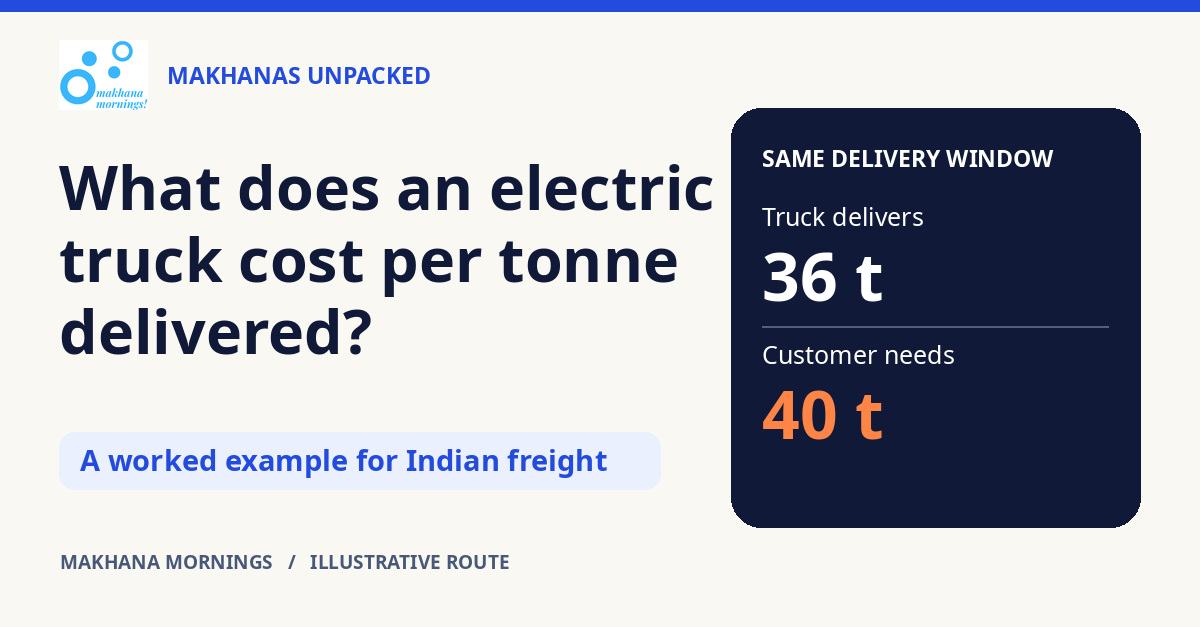
| Tonnes delivered | 36 | 40 |
| Cost per tonne delivered | ₹318 | ₹383 |
Electricity costs ₹10.80/km in this example and diesel costs ₹28.125/km. But those are only energy costs. The electric truck delivers 36 tonnes for every 40 the diesel truck delivers in the base case. If the job needs 40 tonnes that day and a spare truck cannot readily make up the four-tonne gap, the ₹318 is not the cost of fulfilling the job as contracted. Compare fleets at the same service level and price any shortfall or spare capacity before drawing a conclusion.


What does it cost to deliver the same 40 tonnes?
The electric truck delivers 36 tonnes for ₹11,456. Diesel delivers all 40 for ₹15,320. Suppose a backup vehicle can deliver the final four tonnes in the same window. Which hypothetical all-in quote keeps the electric plan cheaper: ₹750 or ₹1,000 per tonne?

Only the ₹750 quote. At ₹750, electric plus backup costs ₹14,456 for all 40 tonnes (₹361.40 per tonne), or ₹864 less than diesel. At ₹1,000, the job costs ₹15,456 (₹386.40 per tonne), or ₹136 more than diesel at ₹383 per tonne.

The options tie at ₹966 for each of the four extra tonnes. Before choosing, get an all-in quote and confirm that backup can meet the same delivery window. These prices are illustrative, not market rates.

Change three inputs before trusting the result
| Change to the electric case, one at a time | Cost per tonne delivered |
|---|---|
| Two runs, 18 tonnes each, ₹9/kWh (base case) | ₹318 |
| Two runs, 16 tonnes each, ₹9/kWh | ₹358 |
| Two runs, 18 tonnes each, ₹15/kWh | ₹382 |
| Average 1.5 runs per day, 18 tonnes each, ₹9/kWh | ₹377 |
| Average 1.25 runs per day, 18 tonnes each, ₹9/kWh | ₹425 |

Fractional runs mean averages across many operating days, not partial trips. Fewer runs here mean fewer kilometres; if a failed dispatch already involved driving or an outsourced trip, add those costs rather than assuming they vanish. The payload examples hold electricity per km constant to show arithmetic sensitivity, not to claim identical consumption at different weights. At two runs and 18 tonnes the electric scenario reaches diesel cost around ₹15.07 per billed kWh, before adding any cost to cover the electric truck’s lower delivered volume. That is a break-even inside this example, not a tariff limit for the industry.
In a pilot, record loaded and empty kilometres, delivered tonnes from weighbridge or dispatch records, billed kWh and litres, queued and charging minutes, truck and charger downtime, and missed delivery slots. Log trips by shift, not just trips on the best day. Check the legal payload for the exact vehicle and body configuration, and use a real depot or corridor tariff, not the price of electricity alone. Rescore the base case without an incentive even if a subsidy looks likely. The Ministry of Heavy Industries’ PM E-DRIVE notices and e-truck operating guidelines show why eligibility and scheme assumptions belong in their own line, not in a generic price.

What a rollout can and cannot show
Montra’s Rhino milestone is a factory milestone, not a statement about operating cost on your lane. Adani Cement’s electric freight rollout illustrates another distinction: a deployment programme can start before its fleet target is realised. Neither story supplies the prices or performance assumptions in this example.
The Crunch: Measure the cost of getting the agreed tonnes to the customer on time. A cheaper kilometre only helps if enough laden runs get through.



Leave your thoughts