
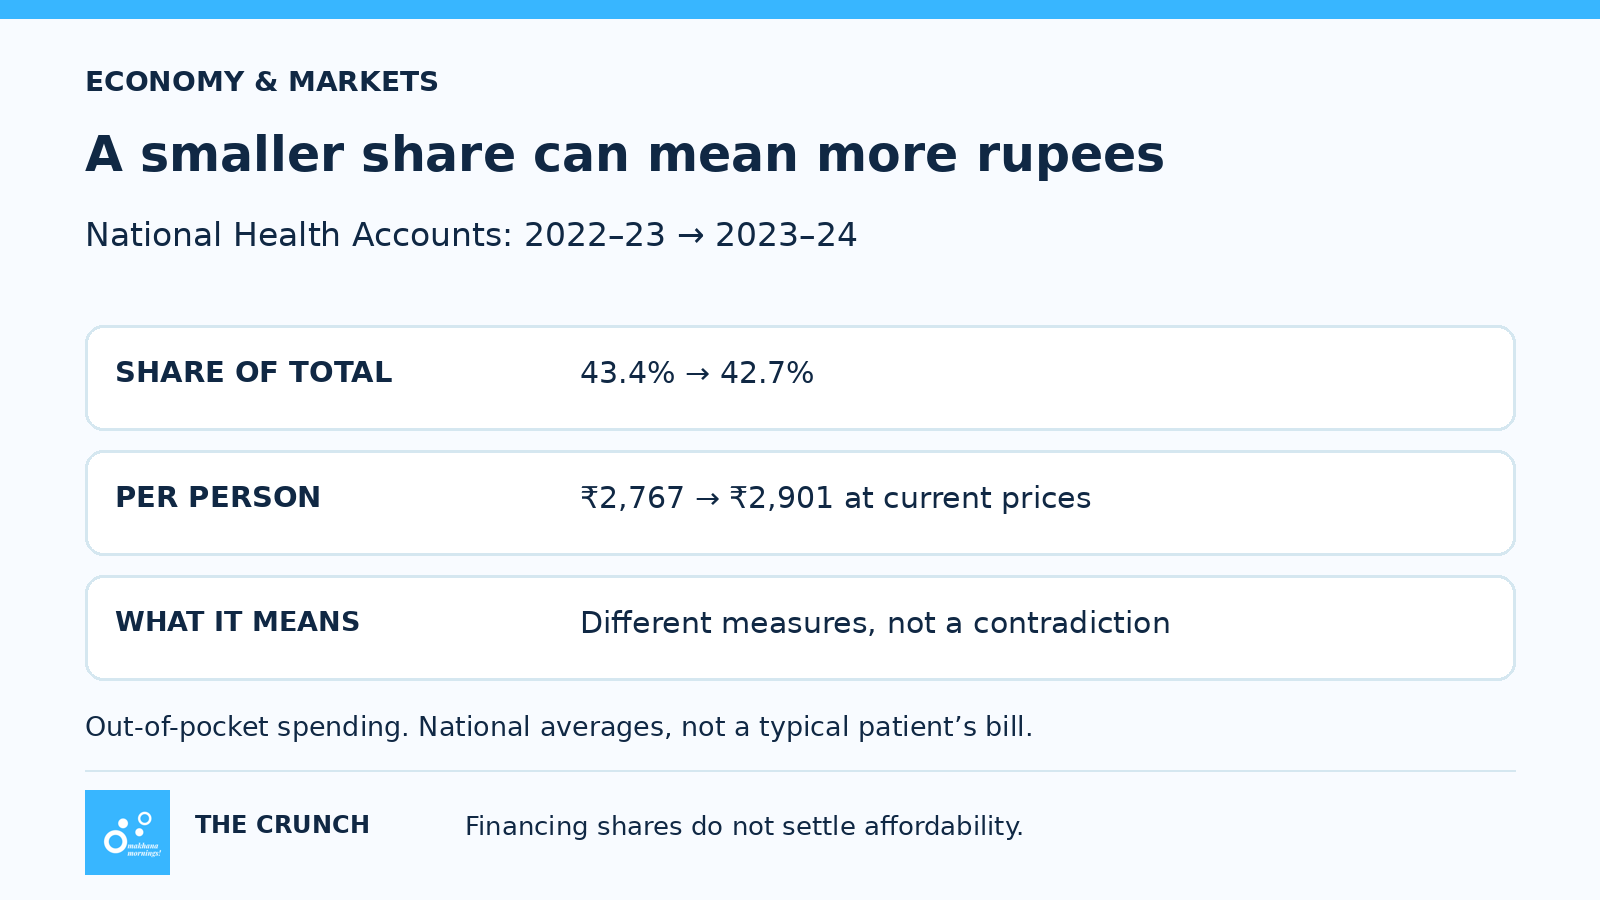
Households paid a smaller share of India’s health spending in 2023–24, but their estimated out-of-pocket spending per person rose. Both findings appear in the latest National Health Accounts. Reading only the percentage misses the distinction.
Out-of-pocket expenditure was 42.7% of total health expenditure, down from 43.4% in 2022–23. Yet its per-capita amount rose from ₹2,767 to ₹2,901 at current prices. That is a national average across the population, not the typical bill for a patient or hospital visit.
The Breakdown
The accounts estimate households’ direct health payments at ₹4,06,197 crore in 2023–24. Total health expenditure was ₹9,52,122 crore, including both current spending and capital expenditure.
The denominator matters. Excluding capital spending, the same household out-of-pocket amount represents 48.52% of current health expenditure. The two percentages answer different questions; neither says what share of an individual family’s income went on treatment.
Government health expenditure reached ₹4,14,196 crore. This is not the Union government’s spending alone. The report assigns approximately 32% to the Union and 68% to states.
Why This Matters
A financing share can fall while the amount paid rises if the overall spending total grows faster. A smaller household slice of a larger total is therefore not a contradiction.
Consider a hypothetical system where households pay ₹40 out of ₹100 in one year, then ₹42 out of ₹120. Their share falls from 40% to 35%, even though their payment rises. This is an arithmetic illustration, not an estimate of India’s spending.
Nor can an increase in nominal spending alone tell us how much medical prices rose. Spending can change because people use more services, receive different treatments or pay different prices. Establishing those contributions requires additional evidence.
The Big Picture
The decade-long comparison is substantial: the out-of-pocket share was 64.2% in 2013–14. But the recent path has not been a continuous decline. The latest report’s series shows 39.4% in 2021–22, followed by 43.4% and then 42.7%.
These are estimates of financing flows for 2023–24, not a reading of household costs in November 2026. They combine administrative records and surveys, including older survey inputs. They should not be treated as a fresh survey following the same families’ bills over time.
For household financial protection, further questions remain: who faces large payments relative to income, which expenses remain uncovered, and whether people can obtain the care they need. An aggregate financing share cannot settle those questions on its own.
The Crunch
The accounts show a change in who finances healthcare. To understand what families experience, keep three measures separate: their share of national spending, the rupees they pay and their ability to afford necessary care.
Leave your thoughts