
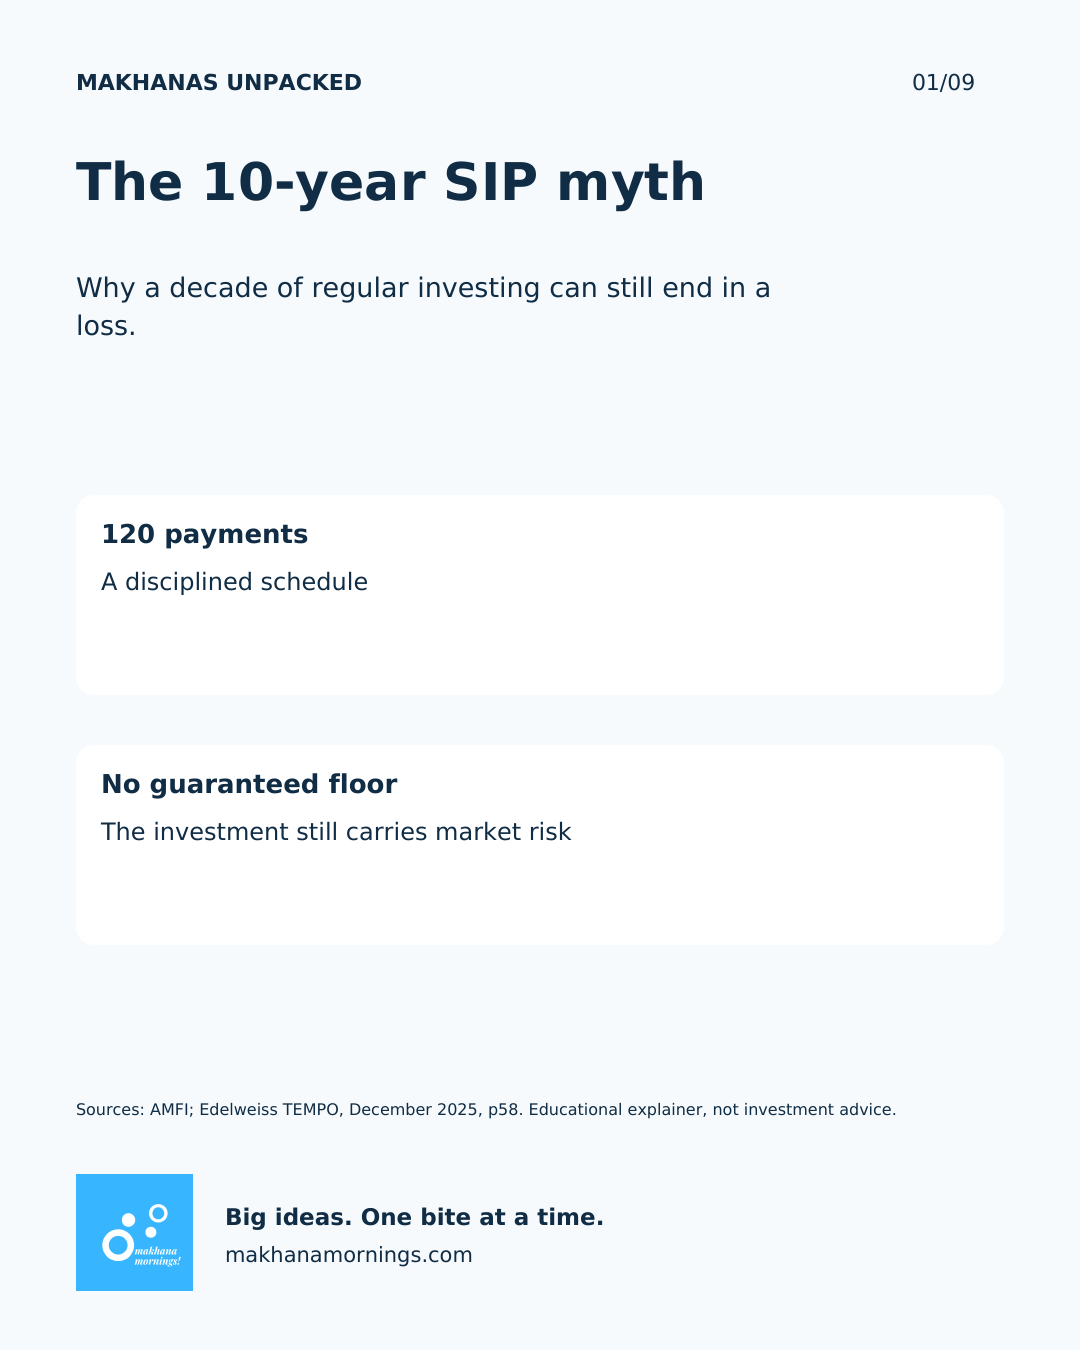
Ten years is a long time to keep a financial promise to yourself. It is easy to turn that discipline into a second promise: surely a monthly investment cannot still finish below the money paid in?
The second promise does not follow from the first. A systematic investment plan, or SIP, sets the payment schedule. The underlying investment determines what those payments buy and what the accumulated units are eventually worth. The myth worth challenging is the guarantee, not the habit.
AMFI’s investor education makes the distinction explicitly: rupee-cost averaging does not assure a profit or protect against investment losses in a declining market. Source: AMFI’s SIP guide.
The Breakdown: a decade of payments is not a decade for every payment

Suppose ₹10,000 goes in at each month-end for 120 months and the portfolio is valued immediately after the last payment. Total contributions are ₹12 lakh. The first payment has been invested for 119 months; the last has had no time to earn a return. Half the payments arrived during the last five years.
The simple average age of those equal contributions is 59.5 months. That is a timeline illustration, not a measure of portfolio duration or a prediction of risk. It explains why a ten-year SIP should not be confused with investing the whole ₹12 lakh on day one and leaving it untouched for ten years.
More units do not create a price floor

Use a smaller, hypothetical example to see the mechanism. Three ₹10,000 payments at net asset values of ₹100, ₹80 and ₹50 buy 100, 125 and 200 units. The investor now owns 425 units at an average purchase cost of approximately ₹70.59.
If the final NAV is ₹60, those units are worth ₹25,500 against ₹30,000 contributed. The investor bought more units when prices fell, exactly as cost averaging is intended to work, and still lost ₹4,500. Even a recovery from the last purchase price of ₹50 to ₹60 was insufficient to lift the value above the total paid in.
This is arithmetic, not a reconstruction of any fund or decade. It isolates the important condition: the final value of all the units must exceed the contributions for there to be a nominal gain. A regular purchase schedule alone cannot enforce that condition.
What the historical evidence actually says

Edelweiss Mutual Fund’s December 2025 TEMPO presentation reports minimum ten-year rolling SIP returns of 5.07% for Nifty 100 TRI, 6.37% for Nifty Midcap 150 TRI and −0.13% for Nifty Smallcap 250 TRI. Its footnote specifies month-end SIPs, monthly rolling observations, Bloomberg as the data source and a cut-off of 28 November 2025. The table is labelled “Since 2015”. Source: TEMPO, page 58.
The negative minimum is a historical counterexample to an absolute guarantee. It does not establish how likely a future loss is, or whether one particular mutual fund will lose. These are total-return index series, not a survey of every fund in each market-cap category. The minimum for an observed sample is also not a lower limit on future outcomes.
Verification note: a newer November 2026 graphic circulating with this story shows different averages. We could not retrieve that edition’s original presentation and full methodology. We therefore use the older, directly checked primary-source snapshot above, do not reproduce the newer average-return comparison, and do not claim to have independently rebuilt the historical return series. The cited slide does not state exact worst-window dates, the observation count, a return formula, an annualisation convention or detailed day-count rules. We do not infer those missing details.
Why rolling returns need careful reading

A rolling study repeatedly moves its investment window forward. With monthly observations, two adjacent ten-year windows share 119 of their 120 payment months. They also experience much of the same market history. A hundred overlapping observations are not a hundred independent experiments.
This matters when an average becomes a promise or a historical success rate becomes a supposed future probability. The number depends on the chosen index, available history, payment dates and ending dates. Changing the sample can change the average while leaving an old minimum unchanged. Without the underlying observations, precision about the probability of loss would be misplaced.
The ₹12 lakh example needs a timing convention

For a transparent illustration, take 120 equal ₹10,000 payments, no withdrawals, equal monthly intervals and a constant 15% effective annual return. Convert that annual rate into a monthly rate using (1.15)1/12 − 1. Month-end payments produce approximately ₹26.00 lakh after the final payment.
Move every payment to the beginning of its month and each receives one extra month of growth. The result becomes approximately ₹26.30 lakh. So ₹26.3 lakh is a defensible illustration with that timing convention, not a universal answer to “₹10,000 for ten years at 15%”. Neither value is a forecast, nor does it assume a real market rises smoothly every month.

Now use −0.13% as the effective annual rate in the same month-end illustration. The final value is about ₹11.92 lakh: approximately ₹7,707 below ₹12 lakh, or 0.64% of total contributions. The annualised rate is not simply a 0.13% deduction from the total amount paid in.
These are independently calculated rate-conversion examples, using a rounded annual rate. They are not the actual rupee result of the study’s worst historical window. Reproducing that would require the exact dated cash flows and index observations. All examples here are before fees and taxes.
For actual SIP cash flows, XIRR is commonly used to calculate an annualised return that takes the dates of investments and the final valuation into account. A lump-sum CAGR applied to the full sum of contributions treats money as though it was all invested at the start, which is the wrong timeline. Source: Edelweiss’s explanation of SIP-return calculation.
The Big Picture: know what the chart represents

NSE Indices lists the Nifty Smallcap 250’s launch date as 1 April 2016 and its base date as 1 April 2005. History before launch therefore predates live publication of the index; it should not be presented as the experience of a fund that was investable throughout that entire period. Source: NSE Indices factsheet, 30 October 2026.
An index comparison also leaves other questions open. A real fund may hold a different portfolio and incurs costs; taxes depend on the investor and transaction. A positive nominal gain can still lag inflation. None of these distinctions can be resolved by reading a single average-return bar.

A useful way to assess a SIP claim is to ask four questions: what investment was tested; which start and end dates were included; how the payments and return were calculated; and which costs or purchasing-power effects were excluded. Those questions are more informative than treating ten years as a magic threshold.
The Crunch
A SIP spreads purchases over time. It does not turn the underlying investment into a guaranteed-return product. The historical negative minimum is useful because it punctures an absolute claim; the payment-by-payment maths explains why that claim was unsafe in the first place.
This is an educational explainer, not a recommendation to start, stop, continue or switch a SIP or choose a fund category. The right choice for an individual depends on their circumstances and the purpose of the money.
Related context: What October’s mutual-fund inflows measured. Flows describe money entering and leaving funds; they do not establish future returns.


Leave your thoughts